Tuesday, June 2, 2009

028. The energy balance of the house: losses

Figure 21. Heat lost from the house.

In the previous post I showed the calculated heat gain for the house. Here we have the calculated heat loss, based on walls and roof (opaque elements, as they're called) with a heat transfer coefficient, U, of 0.13 W/(m2·K) and windows (transparent elements) with a heat transfer coefficient of 1.3 W/(m2·K). One item under discussion at the moment is window upgrades. About 43% of the heat that is lost, is lost through the windows. Reducing the heat transfer coefficient of the windows could have a significant effect on the total heat loss.

Monday, June 1, 2009

027. The energy balance of the house: passive gain

I've been slowing working my way through the results of the energy calculations that the energy planner did for the house based on the provisional plans. The document is about 60 pages long. Parts of the input information and intermediate steps in the calculations are not in it so I first have to try to reconstruct it. Then I can put the information together in a format I want for the purposes of posting here. Let's start to look at the calculation of the energy balance of the house in parts. I won't go into a discussion of the details right now there are already sites[1] where that's done.

Figure 20. Heat gained by the house passively.

Figure 20 shows the passive heat gain predicted for the house, broken down by month. I believe this is before the sun-shading system is taken into account for the summer months. It is clear that without the proper system to suppress the heat gain in the summer, the house would become unbearably hot. Note the drop in June. This must be related to the input data (see figure 16[2] in post 024) and my first reaction was to think this can't be real. However, I've found a similar thing in a plot on another site[3] so it's still an open question for me. On the other hand, it's not really very important.

As I understand, these detailed calculations are usually only done for passive houses, i.e. houses with energy demands that are about half —15 kWh/(m2·a) instead of 38 kWh/(m2·a)— of what ours is going to have. These houses have such low heating needs that the heat generated by people[4] and appliances have a substantial influence. In the graph the lowest two lines represent these internal heat gains. The heat output of a person is taken to be 70 W and a daily 12 hour presence is assumed. The appliances are estimated to contribute 15 kWh/(m2·a). The heavy grey line at the top is then the sum of the solar heat gain and the internal gain. In my next post, I'll talk about the other side of the energy balance (the losses) and the need for additional heating.


[1] One good example is here (in English) → Energy Balances Passive House

[2] Direct link to figure 16 → Solar data from Buchs

[3] PHPP → Passive House Design Package

[4] One passive house joke is that if you feel your house is too cold then you can invite a few of your friends over for dinner to warm it up. We'd have to invite a dozen or so.

Thursday, May 28, 2009

026. Reworking one version of the American Dream

Figure 19. Michelle Kaufmann's mkSolaire house with a 'nutrition' label (see text).

Here's another little aside while I put together another post. To a small extent, I've been following the housing industry in the US over the past couple of years and one of the few names that come up in discussions of environmentally-aware construction is that of Michelle Kaufmann[1]. She's an architect based in Northern California and she aggressively pursued a plan to design and build high-quality, energy-efficient homes in a kind of modular framework. In the last five years her company realized some 40 single family homes in this style. Sadly, the economic downturn has forced some of her supplies to close and has made this aspect of her work unsustainable. In her own words, as published on her blog[2]:

However, we have always known that to pull off our mission, it requires scale. We always believed it would be our company to do the scaling. We were well on our way to do so. However, in this current economic climate, scaling for a small company has proven to be difficult.

A visit to her site makes clear her commitment and thoughtfulness to improving building quality. While there are not a lot of hard numbers on her site, last year she published a white paper[3] presenting the idea of what she called 'nutrition' labels for houses (similar to the European Union energy label[4]). Figure 19 above shows an example of this. With her dedication and her interest in this area, I'm certain she'll be forging ahead with her new projects.


[1] Her website is here → Michelle Kaufmann Designs

[2] The blog post is here → The end of one dream and the beginning of another

[3] The PDF can be downloaded here → Nutrition Labels for Homes

[4] Wikipedia entry → European Union energy label

Wednesday, May 27, 2009

025. The land in May

Figure 18. A cat's view of the land from the street, looking towards the south.

I've been involved in several different tasks at the moment and haven't been able to spend much time on the house project. To let you all know that I'm still involved with the blog, here's a recent photograph of the land with the Bauprofile poles in the ground. They'll be removed the first week of June.

Tuesday, May 19, 2009

024. Solar radiation intensity over Switzerland and our region

Figure 15. Annual solar radiation over Switzerland.

Solar radiation is a major source of energy for our house. Here is an overview of how much energy is actually available to us from the sun. The map in figure 15 (pvgis-solar-optimum) shows the yearly sum of irradiation available to optimally inclined collectors in different parts of Switzerland. The high intensity regions in brown in the south are the Alps. Our house will be in the north near Zürich, in one of the least sunny areas of the country. But, there is still quite a bit of energy to be gained as can be seen in the graph in figure 16.

Figure 16. The monthly solar radiation measured at our reference weather station in Buchs, broken down by the cardinal directions. That drop in the intensity in the south in June is strange. Must look into that.
Figure 17. The average monthly temperature.

Data and calculators covering most of Europe is available here → Photovoltaic Geographical Information System

Friday, May 15, 2009

023. Where our electricity comes from

Figure 14. Breakdown of the electricity sources in our locality.

As our plans currently stand we will be using electricity to cover the parts of our energy demand that are not met by either solar gain or the energy extracted from the environment via the heat pump.

In the locality where we're building the major share of the electricity supply is from nuclear power plants. About three-quarters of that is generated domestically while the remainder is purchased from abroad (most likely France). In the hydroelectric and renewable group, hydro actually accounts for most of it. Only about 0.01% of the total supply comes from sources such as wind, biomass and photovoltaic arrays.

About 2.7% of the supply comes from waste. There are facilities that incinerate garbage (Kehricht-verbrennungs-anlage = KVA, aka Müllverbrennungsanlage in Germany) and use the energy from the process to produce both electricity and also provide heat for direct use (Fernwärme which can be translated as district heat). One such facility in the region is in Turgi near Brugg and they serve a total of about 200,000 people. They generate 7.7 MW of electricity and 18 MW of thermal energy for the Fernwärme system. District heat could have been a possibility for our house[1]. The problem is that the connection costs are rather high.


[1] Using district heat would lower our weighted energy demand to 33.2 kWh/(m2·a) from the 35.7 kWh/(m2·a) calculated → here

Thursday, May 14, 2009

022. Approved

Figure 13. The stamp of approval.

A short update on what's been happening: Our building application has been approved by the local building commission. Now we get down to the real details.

Tuesday, April 28, 2009

021. Calculation of our energy demand (Minergie-Nachweis)

We received a copy of our Minergie-Nachweis (der Nachweis = certificate), computed by an energy planning firm, several weeks ago and since then I've been busy with the different aspects of it. What this is is the calculation of the projected energy needs of the house and how they are to be met. It's a detailed document with inputs ranging from the location and orientation of the house (to calculate the solar gain and also heating needs based on the average monthly temperatures) to the construction details of the connection between the walls and the foundation (to calculate the amount of heat lost through thermal-bridges[1]). Not all the details are finalized yet; however no subsequent change should increase the heat demand so let's take a look at the end results of the calculations. I'll explore the individual parts of the work-up later as time permits.

I'll start off by referring to these two old posts where I had talked about the Minergie limit on the weighted energy demand: The weighted energy demand The weighted energy demand, part II

We had the following relationship (click on the equation to see a larger version) which states that the weighted energy demand of a standard Minergie house may not exceed 38 kWh/(m2·a). So per year,

where (i) QH,eff is the amount of heat required to maintain a comfortable indoor temperature (usually taken to be 20°C) (ii) QWW is the amount of heat used to prepare hot water, and (iii) QV is the amount of energy required to run the ventilation system.

The g terms are the weighting factors for the particular type of energy source chosen and the η's (eta) are (or are analogous to) the efficiencies of the devices used. Small g's and large η's are good, for lists of some of the commonly used ones see the old posts.

For our house, the energy demands are computed to be: QH,eff = 31.4 kWh/(m2·a) QWW = 13.9 kWh/(m2·a) QV = 3.02 kWh/(m2·a)

You will note that this adds up to (31.4+13.9+3.02) kWh/(m2·a) = 48.3 kWh/(m2·a). This exceeds the limit of Minergie, but this is not yet weighted. Let's do that now. Some additional information specific to the heat pump chosen for the house is necessary for this step. The heating device is an air-source heat pump which runs on electricity and covers 100% of the room heating needs (ηH = 3.88) and 80% of the hot water needs (ηWW = 3.04). The remaining 20% of the hot water needs is covered by an electrical heater (ηWW = 0.9). Some of you might recall that the weighting factor g for electricity is 2.0. The weighted energy demand is then calculated to be 35.7 kWh/(m2·a) and thus satisfies the Minergie requirement. Here it is written out in equation 2 (click on the image to enlarge it):


[1] Wikipedia entry on thermal bridges → Thermal bridge

Sunday, April 19, 2009

020. Canton Aargau doubles subsidies for solar collectors and more this year

If you're thinking of building or renovating in canton Aargau, then this might be of interest. This year the subsidies for solar collectors and photovoltaic cells for homes have been doubled. In addition, there's now a subsidy to replace electrical heating systems with underfloor heating systems which use water as the heat transfer medium. Furthermore, for renovations of existing homes, the canton is doubling the subsidies given by the Klimarappen Foundation! The following is an overview of the items relevant to new construction. For more information, visit the links at the very bottom of the post.

Solar thermal collectors

Flat plate systems (Flachkollektoren)
CHF 3000.- for 4 m2 to 8 m2
CHF 1250.- plus CHF 220.- per m2 for installations between 8 m2 and 15 m2

Evacuated tube systems (Röhrenkollektoren)
CHF 3000.- for 3 m2 to 6 m2
CHF 1250.- plus CHF 280.- per m2 for installations between 6 m2 and 12 m2

Solar cells (Photovoltaic)

CHF 3500.- per kWP for an integrated system
CHF 2900.- per kWP for an add-on system
CHF 2500.- per kWP for a free-standing system

Heat pumps (Wärmepumpen)

CHF 3000.- for either a ground-source or groundwater-source unit up to 20 kW

Aargau Departement Bau, Vehrkehr und Umwelt → Fachstelle Energie (Aargau)

Climate Cent Foundation → Stiftung Klimarappen

Friday, April 17, 2009

019. A simple ventilation plan

This post follows from an earlier one in which I mentioned the Komfortlüftung mit Wärmerückgewinnung (comfort ventilation with heat recovery) system. The primary consideration for the indoor air quality in terms of designing a ventilation system is the amount of CO2 in the air. On average, a person produces between 30 and 40 grams of CO2 per hour. According to current Swiss building code, the concentration of this gas should not exceed 1000 ppm.
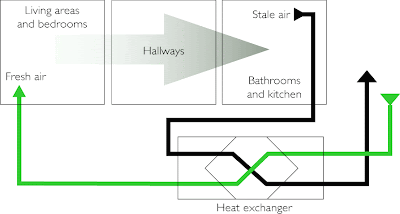
Figure 12. A simple ventilation scheme for a residential unit.

A schematic of the ventilation plan is depicted in figure 12 above. There are two parts, the supply and the exhaust and there's a heat exchanger (a topic for several other posts, no doubt) through which upto 90% of the heat of the stale air can be transferred to the fresh air. There's no physical mixing of the gases and an optional filtering system can remove pollen and dust from the incoming air. Odors though are another matter. The exhaust vents are installed in the kitchen and the bathrooms so that the air from these areas isn't dragged through the house. Fresh air is let into the living areas and the bedrooms. The system is configured to operate continuously during the heating period with an option to also run during the summer. People who live in noisy areas, such as near heavily used streets, can choose to run the system during the summer as well so that they can keep out the noise.

Based on the limit on the CO2 concentration in the air, the recommendation is for an hourly intake of 22 m3 to 36 m3 of fresh air per occupant. A different method of calculating the intake that is independent of the number of occupants is to assign an hourly replacement rate of 30 m3 per room, except for bathrooms and kitchens which are designed to have a higher rate with a minimum of 40 m3 per hour. The sums of the supply and the exhaust must equal each other so that there's no pressure difference between the inside and the outside of the house, and so the higher rate of the two is chosen. This is best explained with an example: Consider a unit with 3 bedrooms and a combined living/dining room which is counted as 1.5 rooms, so a total of 4.5 rooms → 135 m3/h of fresh air coming into the unit. If there are 2 bathrooms and a kitchen then the exhausts from those add up to 120 m3/h. In order to not create a pressure difference between the house and the outside, the exhausts should be raised from the prescribed 40 m3/h to 45 m3/h per room.

I haven't mentioned anything about humidity in this post, though I have mentioned in the previous post that too much of it is a serious problem during the heating months in our current apartment where we must manually ventilate to avoid problems such as mildew associated with high humidity and cold surfaces on which condensation can occur. With the ventilation set-up described in this post, the usual result is that the air is too dry in the winter. Plants can help and there are certain types of heat exchangers that also recover some of the humidity from the outgoing air. Humidifiers are not recommended due to issues of hygiene and the additional energy usage.

Exactly how the system is going to be for our house is not yet defined.

Much of the information here is based on that at the following site → Luftwechsel: Die Platform für Wohnungslüfter

Tuesday, April 14, 2009

018. Peter Zumthor receives the 2009 Pritzker Prize

Figure 11. Entrance to the Saint Benedict Chapel in Sumvitg, Switzerland. Photo by Luke Stearns.

I would be remiss if I didn't acknowledge this bit of news, even if it is a bit off topic. I've been meaning to visit some of his works for a while now but given their relative remoteness I haven't made the trips yet.

Entry on the Pritzker Prize website: 2009 Laureate, Peter Zumthor.

Sunday, April 12, 2009

017. Ventilation in air-tight buildings

The air-tightness of buildings is great from the energy loss point of view but there are serious negative consequences on the indoor air quaiity that must be mitigated. Our personal experience in the conventional 1980s built apartment we currently occupy is that during the winter (i.e. the heating period when we normally have the windows closed) we get the best result by opening all the windows for about 5 minutes, usually twice a day. 'Best result' in terms of our own perceptions of things like humidity and staleness: we haven't done any tests to monitor the actual air quality and things like VOC[1] build-up. A little guide which came with our apartment suggests that we air out the place 'several' times a day, an expectation which we find a tad ridiculous. Not only is this impractical from a scheduling point of view, it also results in the loss of a heat energy through the replacement of the warm indoor air with the cold outside air. While this used to be an acceptable form of ventilation for Minergie homes, as of 2009 mechanical means of ventilation are required.

There are six different standard solutions to choose from and we are probably going to install what's called Komfortlüftung mit Wärmerückgewinnung (comfort ventilation with heat recovery), illustrated in Figure 10. I should mention here that the list also includes an automated window ventilation system, in which the windows are opened and closed by computerized motors and which does not incorporate heat recovery.

Figure 10. Schematic of a ventilation system which incorporates a heat recovery system.

Some people here have an aversion to centralized ventilation systems as they expect them to cause draughts throughout the house and harbor mold and bacteria in the ducts. The first issue is an easy one to address as the rates of flow in a properly dimensioned system are too low to be noticed and this is easily experienced by spending a couple of hours in a house with such an installation. The second one isn't quite so easily answered and one has to convince oneself that a duct system built and maintained to the current recommendations will provide good air quality. More about all this in the next post.


[1] About volative organic compounds at the Minnesota Department of Health → VOCs in your home

Saturday, April 11, 2009

016. An air-tight building envelope

We've already seen that the first step in making energy efficient buildings is a thick layer of insulation. Once the heat loss via conduction through the building shell is minimized, the amount of heat that is lost via air leaks in the shell becomes notable. Not only that, there's also increased risk of condensation around the areas of the leaks and consequently increased possibility of mold growth. With current technology, it turns out to be energetically favorable to make the shell 'air-tight' and incorporate a mechanical ventilation system equipped with a heat exchanger to replace the indoor air. More about this in the next post.

The air tightness of a building is quantified by measuring how many times in one hour the entire volume of air in it is replaced when the building is subjected to a pressure difference of 50 Pascals (1 Pascal ≡ 0.0003" of mercury). The test is called the Blower Door Test[1] and the quantity measured is called the air exchange rate and is denoted as nL50. This test is mandatory for Minergie-P houses where nL50 must be shown to be less than 0.6 [1/h]. In other words, it takes about 2 hours for the air in the house to be replaced by air from the outside. A mechanical ventilation system is required to refresh the air and I'll talk about in the next post. For plain Minergie houses this test is not required but it is expected that the level of air-tightness be less than 1 [1/h]. For comparison, consider that a 1989 survey of 35 Swiss timber homes done by EMPA[2] showed that they had an average air exchange rate of about 7 [1/h]. Current construction without special consideration to air tightness is somewhere around 3 [1/h].


[1] About the Blower Door Test on Wikipedia → Blower Door Test

[2] Kropf F., et al. Luftdurchlässigkeit von Gebäudehüllen im Holzhausbau → EMPA Bericht 218, 1989

Wednesday, April 1, 2009

015. The Baugesuch

Figure 9. The Bauprofile marks out the edges and corners of the building.

The application (Baugesuch or Baueingabe in German) for our building permit (Baubewilligung) was recently submitted to the local building commission. It includes blueprints of the house, plans for the connections to the water, sewer and electricity supply lines and an analysis of the energy usage (Energienachweis). In addition to these things one is also required to physically mark out the corners of the proposed building on the land as shown in figure 9 above. This is known as the Bauprofile (aka Baugespann or Bauvisiere and it allows the commission and other interested parties to visualize the building and easily ascertain that none of the building limits are exceeded. As part of the approval process a period of time, usually two or three weeks, is set aside to give the neighbors the chance to file objections or concerns. There's a form for this and the objections (Einsprache) have to be submitted in writing. Naturally, we're hoping that there will be none against our plans. It's an interesting process.